YARA rule are amazing tools to check for malicious activity, Wazuh SIEM offer the capabilities to scan in real time events for malicious file throught yara rules.
This functionality need to be configured in active-response options on the wazuh-manager and wazuh-agent as well.
For testing purporse i have import a yara rule to detect malicious webshell, that can be found on github, and created a test file containing some malicious code related to webshell:
The malicious code finded is related to Honker Webshell in this case, in fact the test file contain the following code:
You can scan manually yara rule, or you can ingest and scan with active-response by Wazuh and send it to the SIEM for generating alerts.
For the configuration in Wazuh, please follow this steps:
Implementation is little bit complicated, but you can understand python implementation and enrich your data in Python.
The result of the API Request will be loaded in ossec Queue and written, and finally you can see you custom data integration available in wazuh / ELK .
I will try to get officialized in new Wazuh Integration available for new installation out of the box (for example as VirusTotal integration for Wazuh).
This payload will use PE Header and COFF format for injecting a DLL into memory/process.
Even if the PC reboots by the action of registering registry, the powershell command that performs the same behavior is run. Afterward, the Loader reads the Injector binary from the [Username] key, load it to the memory, and run it
In order to be able to detect you should follow this steps:
Detect powershell execution
Decode Base64 payload
Check for matching substring like: ToByte or HKCU\SOFTWARE or Reflection.Assembly function execution
Reflection.Assembly function is used for loading the DLL by starting from a dropper PE or COFF format.
The scope of the article is to explain how to utilize tensorflow for analyze a windows logs, coming from Sysmon.
I used the following script below that run a query on Elasticsearch, ingest the logs, parse the logs, create a dataframe and next use tensorflow on the dataframe!
Please note that the Index of the dataframe in this case is static (I not memorized in a variable, because it is just an example).
res = elastic.search(index="wazuh-alerts-3.x-2021.03.13", body={"query": {"match_all": {}}}) #print(res['hits']['total']) for hit in res['hits']['hits']: d.append(hit["_source"]["data"]["win"]["eventdata"]["targetUserSid"])
Finally you will be able to see the Density of utilizing graphically in order to understand some malicious Behaviour, the image talks clearly: The first SID is used more in the first part of the logs, and the other SID is used more on the last parts of the Logs analyzed.
You can add some other information, like the number of the hist, the time, and everything correlated to a SID logs by sysmon… :))
Hope you enjoyed it!
Notice the function by the Last Graph of the “eventID” type, and the previous one about the SID!
This can help to visualize better information about incidents (large datasets).
Additionally i prepared for example two example graph below, from two different days.
The first day, as you can see there is no anomaly based on the assumption that one ip is connecting to one destip to a service. This depends on your network complexity of course, this is a simple network configuration, with not too much traffic.
Each source ip is connecting to only one service.
But for example on different day, you can see a sort of “anomaly” based on the knowledge base:
As you can see on the fourth row, there is a major activity 🙂 This because a source ip is connecting to multiple services… this can be marked as “anomaly”! 🙂
Finally, you can plot an anomaly with differents color and pivot over 2 parameters, in this case 2 differents destination ports used by the same destination IPs.
In this example is represented the destination port: 161, and 8013, that belongs to an anomaly detection, because is major of a parameter decided in the algorithm. Is the last graph in the right corner with two differents color!
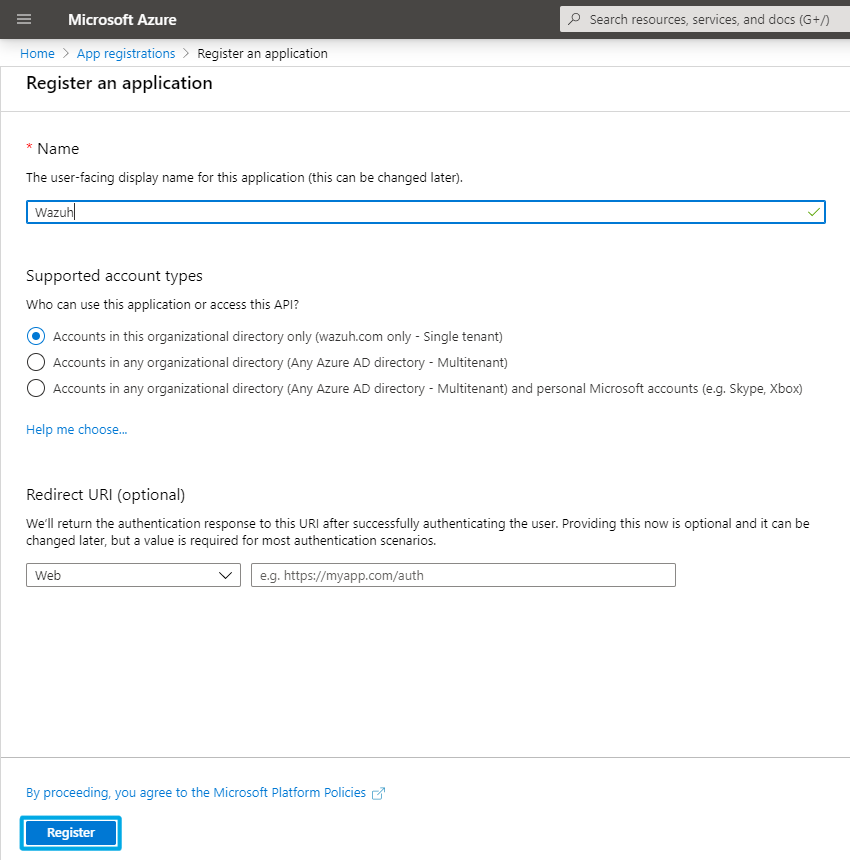
In this article we will cover a topic related to Office365 logs ingestion in SIEM solution, by API in JSON format:
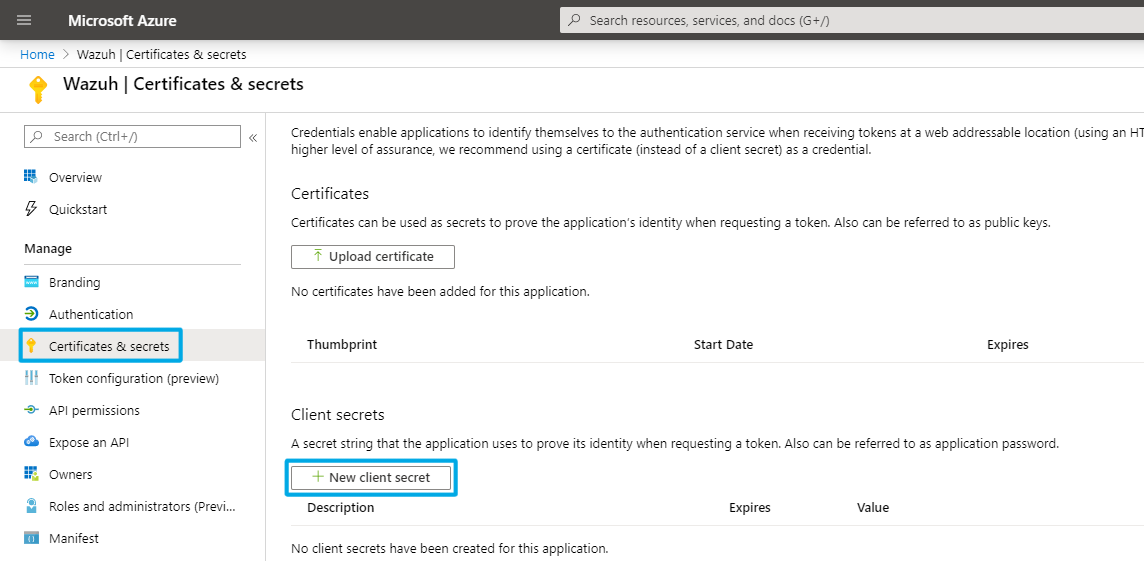
BEFORE CONTIUNE, YOU HAVE TO ENABLE YOUR CUSTOM APPLICATION ON OFFICE365 Management
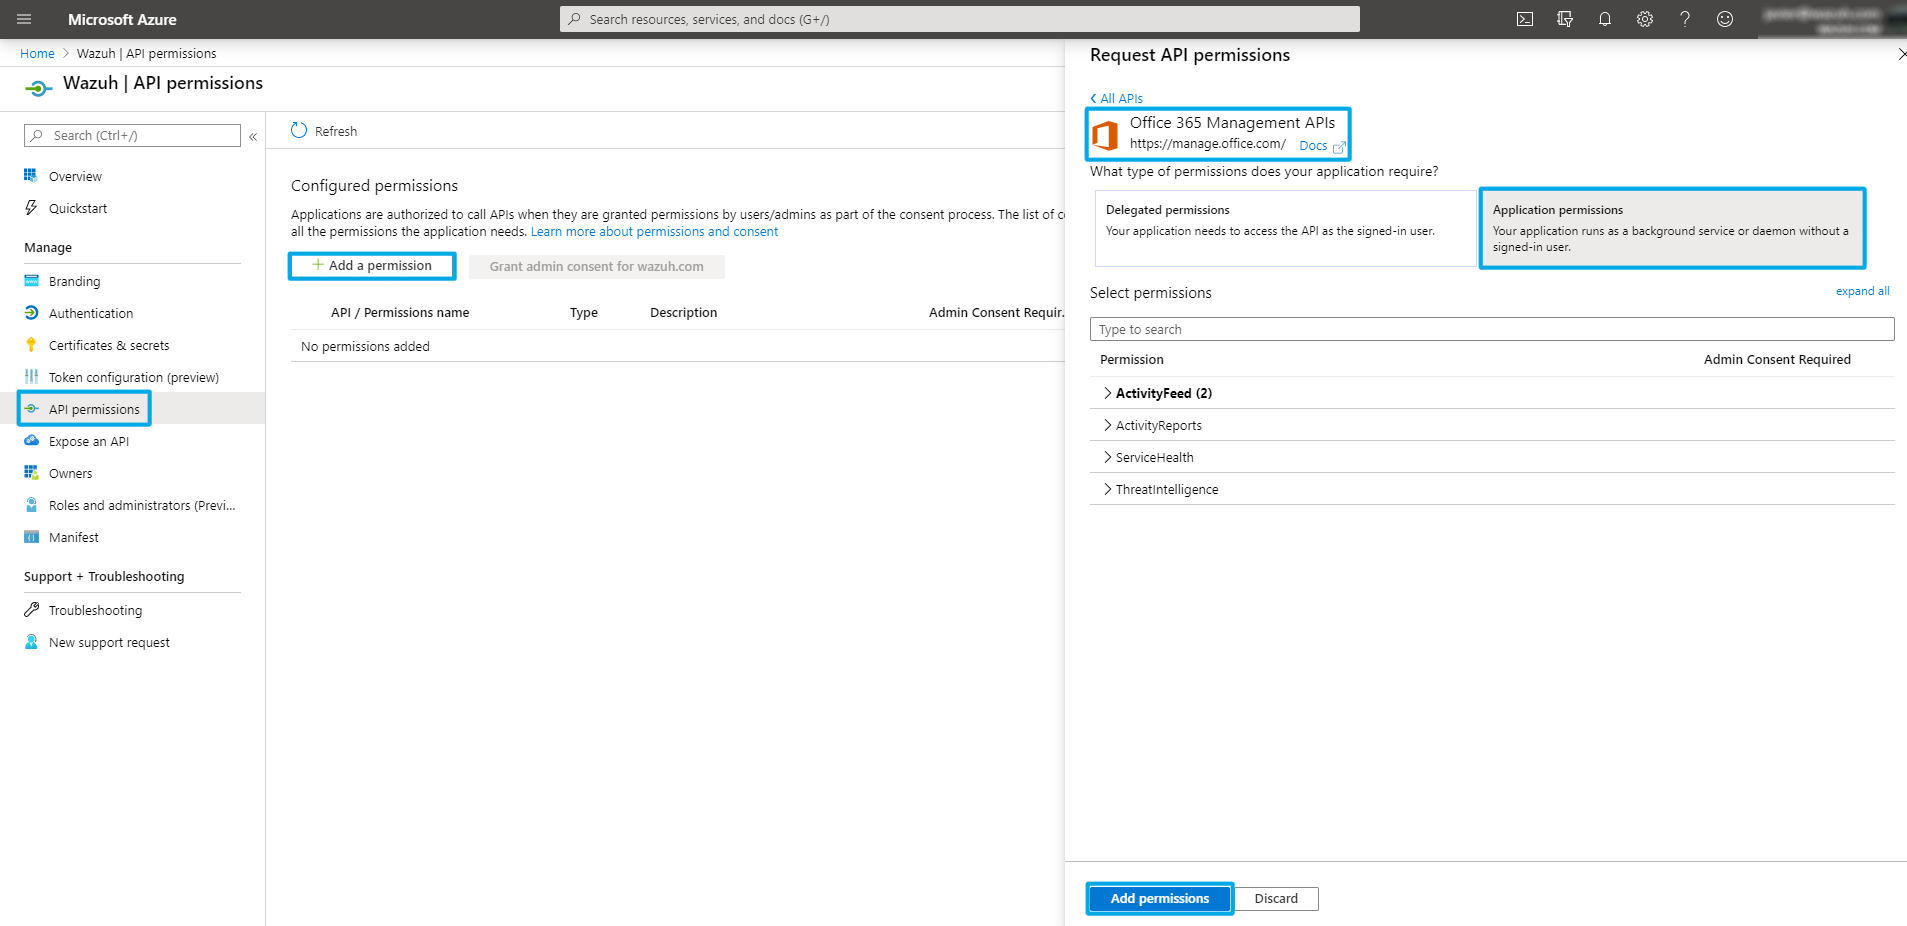
And finally enable API Permission for this custom app:
ActivityFeed.Read. Read activity data for your organization. ActivityFeed.ReadDlp. Read DLP policy events including detected sensitive data.
The script below is related and utilized for Wazuh SIEM, but you can also integrated for any other SIEM type that is able to ingest the logs in JSON format.
You have only to modify the socket where to write: socketAddr = ‘/var/ossec/queue/ossec/queue’, or in alternative write the JSON to a file and next ingest and parse it for a SIEM solution.
Perform an API request to Office 365 management API
def make_api_request(method, url, token): # Create a valid header using the token headers = {‘Content-Type’:’application/json’, ‘Authorization’:’Bearer {0}’.format(token)}
# Make API request
response = make_request(method, url, headers=headers)

# If this is a POST request just return
if (method == "POST"):
    return None

json_data = json.loads(response.text)

# If NextPageUri is included in the header and it has content in it
if 'NextPageUri' in response.headers.keys() and response.headers['NextPageUri']:
    logging.info("New data page detected in {}.".format(url))

    # Request new page and append to existing data
    record = make_api_request(method, response.headers['NextPageUri'], token)
    json_data.extend(record)

return json_data
Manage content type subscriptions
def manage_content_type_subscriptions(contentTypes, clientId, token): # For every available content type for contentType in availableContentTypes: # If it was added as a parameter then start the subscription if contentType in contentTypes: make_api_request(“POST”, “{}/api/v1.0/{}/activity/feed/subscriptions/start?contentType={}”.format(resource, clientId, contentType), token) logging.info(“{} subscription was successfully started.”.format(contentType))
############################################ Main workflow
# Start logging config
if args.debug:
    logging.basicConfig(level=logging.DEBUG, format='%(asctime)s: [%(levelname)s] %(message)s', datefmt="%Y-%m-%d %H:%M:%S",)
else:
    logging.basicConfig(level=logging.INFO, format='%(asctime)s: [%(levelname)s] %(message)s', datefmt="%Y-%m-%d %H:%M:%S",)

# Disable warnings
requests.packages.urllib3.disable_warnings()

try:
    # Obtain access token
    token = obtain_access_token(args.tenantId, args.clientId, args.clientSecret)

    response =make_api_request("GET", "{}/api/v1.0/{}/activity/feed/subscriptions/list".format(resource, args.clientId), token)
    # Start/stop subscriptions depending on the content_types parameter
    manage_content_type_subscriptions(args.contentTypes, args.clientId, token)

    # Build time range filter
    currentTime = datetime.datetime.now(datetime.timezone.utc)
    endTime = str(currentTime).replace(' ', 'T').rsplit('.', maxsplit=1)[0]
    startTime = str(currentTime - datetime.timedelta(hours=args.hours)).replace(' ', 'T').rsplit('.', maxsplit=1)[0]

    # For every content_type in the content_types parameter
    for contentType in args.contentTypes:
        # If it is a valid content_type
        if contentType in availableContentTypes:
            # List the subscription content
            subscription_content = make_api_request("GET", "{}/api/v1.0/{}/activity/feed/subscriptions/content?contentType={}&startTime={}&endTime={}".format(resource, args.clientId, contentType, startTime, endTime), token)
            logging.info("{} subscription was successfully listed.".format(contentType))

            # For every blob in the subscription
            for blob in subscription_content:
                # Request activity information
                data = make_api_request("GET", blob["contentUri"], token)
                logging.info("Blob in {} subscription was successfully fetched.".format(contentType))

                # Loop every event and send it to the Wazuh manager
                for event in data:
                    office_365_event = {}
                    office_365_event['office_365'] = event
                    send_event(json.dumps(office_365_event))

except Exception as e:
    logging.error("Error while retrieving Office 365 activity logs: {}.".format(e))
In this short article i will show you how to use Machine Learning Module to detect threats in your environment with ELK.
First you have to setup a ML module and activate on ELK with Platinium Features license.
Next you can run differents jobs based on your index… for example in this case i made a anomaly detection job on alert by the SIEM:
You can define as well your custom metrics, or use standalone metrics built in in ELK.
The interesting part is the detection of threats for example based on different “influencer”, in this case source ip and agent ip:
As you can see there is a red spike on 11 January, where you can see better in the next chart.
In the anomaly explorer you can see everything related to the src ip and agent influencer that can be strange based on the ML alghoritm of ELK
In this case was a Mirai Botnet scanning/dos attempt.
Please Note the ML is over the dataset you define, the algorithm calculate the average parameter over the period you selected, and as output they visualize the “anomaly” detected parameter and the anomaly score (in this case 96). You can use also Linear Regression or your own ML algorithm over a dataset, but for quick overview of anomaly this algorithm and chart are well!
Below the chart there are explained the parameter references for the ML: IN THIS CASE THE Detector type, the data found and influenced by. Most important the Actual size and Typical size with description (more than 100x Higher than average.)
I came accross this error in ELK/Kibana, and was unable to visualize the logs in the dashboards. The logs was sendend and available in the ELK stack, but unable to visualize.
The only logs that was helping me was the error log saying: “unexpected error while indexing monitoring document”. This is a generic error of ELK.
After a couple of hours of troubleshooting, i found a strange error in the index:
Below some information about how to detect process masquerading in Windows Environment, with auxilium of ELK stack and Wazuh.
Below some references in MITRE ATT&CK:
Technique: Sub-Technique
Adversaries may attempt to manipulate features of their artifacts to make them appear legitimate or benign to users and/or security tools. Masquerading occurs when the name or location of an object, legitimate or malicious, is manipulated or abused for the sake of evading defenses and observation. This may include manipulating file metadata, tricking users into misidentifying the file type, and giving legitimate task or service names.
Renaming abusable system utilities to evade security monitoring is also a form of Masquerading.
The idea is to detect any variations of directory and subdirectory in C:\Programs and C:\Programs Files, below Wazuh rule to detect, in KQL and some references for EQL from a Security Researcher.
data.sysmon.image : (“C:\ProgramFiles\.exe”) or (“C:\ProgramFiles\ and ‘‘ ‘”) and (NOT “C:\Program Files (x86)\.exe”) and (NOT “C:\ProgramFiles\.exe”) and (NOT “C:\Program Files\.exe”)
Wazuh Detection Rule:
Three different level 0 to ignore false positive and two detection rule with capabilities to detect masquerading.
Use tools that restrict program execution via application control by attributes other than file name for common operating system utilities that are needed.
Use file system access controls to protect folders such as C:\Windows\System32.
Detection
Collect file hashes; file names that do not match their expected hash are suspect. Perform file monitoring; files with known names but in unusual locations are suspect. Likewise, files that are modified outside of an update or patch are suspect.
If file names are mismatched between the file name on disk and that of the binary’s PE metadata, this is a likely indicator that a binary was renamed after it was compiled. Collecting and comparing disk and resource filenames for binaries by looking to see if the InternalName, OriginalFilename, and/or ProductName match what is expected could provide useful leads, but may not always be indicative of malicious activity. [12] Do not focus on the possible names a file could have, but instead on the command-line arguments that are known to be used and are distinct because it will have a better rate of detection.[13]
Look for indications of common characters that may indicate an attempt to trick users into misidentifying the file type, such as a space as the last character of a file name or the right-to-left override characters”\u202E”, “[U+202E]”, and “%E2%80%AE”.
Adversaries may establish persistence and/or elevate privileges by executing malicious content triggered by AppInit DLLs loaded into processes. Dynamic-link libraries (DLLs) that are specified in the AppInit_DLLs value in the Registry keys HKEY_LOCAL_MACHINE\Software\Microsoft\Windows NT\CurrentVersion\Windows or HKEY_LOCAL_MACHINE\Software\Wow6432Node\Microsoft\Windows NT\CurrentVersion\Windows are loaded by user32.dll into every process that loads user32.dll. In practice this is nearly every program, since user32.dll is a very common library. (Citation: Endgame Process Injection July 2017)
Similar to Process Injection, these values can be abused to obtain elevated privileges by causing a malicious DLL to be loaded and run in the context of separate processes on the computer. (Citation: AppInit Registry) Malicious AppInit DLLs may also provide persistence by continuously being triggered by API activity.
The AppInit DLL functionality is disabled in Windows 8 and later versions when secure boot is enabled. (Citation: AppInit Secure Boot)
We used red canary atomic tests:
Basically, this event triggers-> reg.exe and tasklist.exe
You can easily create a rule to detect with Sysmon one or both of this two events.
Below some procedures that are used by this technique
Some variants of Cherry Picker use AppInit_DLLs to achieve persistence by creating the following Registry key: HKEY_LOCAL_MACHINE\SOFTWARE\Microsoft\Windows NT\CurrentVersion\Windows "AppInit_DLLs"="pserver32.dll"[4]
If a victim meets certain criteria, T9000 uses the AppInit_DLL functionality to achieve persistence by ensuring that every user mode process that is spawned will load its malicious DLL, ResN32.dll. It does this by creating the following Registry keys: HKLM\Software\Microsoft\Windows NT\CurrentVersion\Windows\AppInit_DLLs – %APPDATA%\Intel\ResN32.dll and HKLM\Software\Microsoft\Windows NT\CurrentVersion\Windows\LoadAppInit_DLLs – 0x1.[6]
For better detection, use file integrity for checking directly on windows registry modification as below:
Notification. 2020 Nov 17 12:41:07 192.168.65.55->syscheck-registry Rule: 100344 fired (level 12) -> “test” Portion of the log(s): File ‘[x64] HKEY_LOCAL_MACHINE\Software\Microsoft\Windows NT\CurrentVersion\Windows’ checksum changed. Old md5sum was: ‘1f25b8fbcf277c5afa2fdd5f7f5c0a5e’ New md5sum is : ‘3e0e5ff04342960fc2db781828d6bdbc’ Old sha1sum was: ‘1657d295d618317c46a8e3584c89fe33dd80531c’ New sha1sum is : ‘9425c6948fa4433bdecdef205fa91629cddcd6dd’